
Plot panel
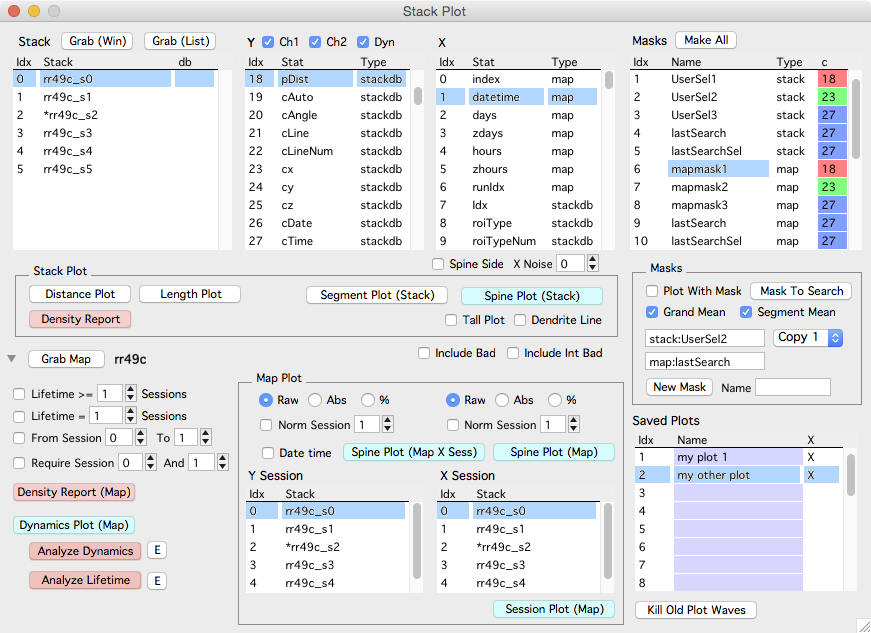
The plot panel provides an interface to make stack and map plots.
Plotting a stack
- Select a stack in the stack list
- Select a Y stat
- Select an X stat
- Press ‘Spine Plot (stack)’ button
Plotting a map
- Specify the map to plot with ‘Grab Map’ button.
- Select a Y stat
- Select an X stat
- Press ‘Spine Plot (map)’ button
Both the Y and X values can be normalized to a session as an absolute change (Abs) or a percent (%). We call this normalization session the ‘zero session’. The zero session for each map can be set in the main map manager panel using ‘Zero Session’. This can be over-ridden in the plot panel by turning on the checkbox and specifying a ‘Norm Session’
Saved Plots
Once a map plot is created, Saved Plots allows the x/y plot statistics to be grabbed and reused quickly. This saves time as the number of statistics in each x/y list is large and the names of each statistic is rather cryptic.
Right-click a row in the list of Saved Plots and select a menu:
- Grab Plot Window. Grab the x/y statistics from the top-most map plot and save it in the selected row.
- Fill In Interface. Take a Saved Plot and fill in the x/y statistics in the stack plot panel.
- Delete Plot. Delete a saved plot.
Once a plot is saved (with ‘Grab Plot Window’), the x/y statistics can be filled in by double clicking.
Double-click on a Saved Plot name to set its name.
Saved plots are saved with the global map manager options in the main map manager options panel.