Stack plot
A stack plot shows a value/statistic for all 3D annotations in a single stack. Each point is a value/statistic for one 3D annotation in the stack.
All stack plots are interactive. Selecting an annotation will propagate this selection to other stack and map plots.
Making stack plots
From the stack window

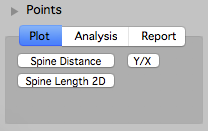
All stack plots in the stack window are in the ‘plot’ tab. Open the annotation control bar with keyboard ‘[’.

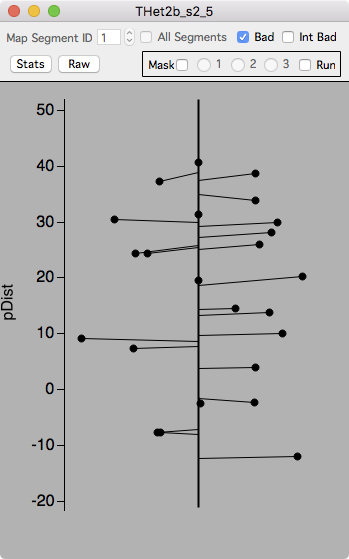
Spine Distance. Example stack plot of position of spines along a dendritic segment. Spines can be on different sides of the dendrite and are shown here on the left or right of the dendritic segment.
Stack plots are automatically generated for one segment, segment 1 in the example.
- Map Segment ID. To visualize different segments.
- All Segments. To visualize all segments in a stack.
- Bad.
- Int Bad.
- Stats. Display a summary table of statistics of annotations in the plot. Statistics include segment mean, standard deviation, standard error, and n.
- Raw. Display a table of the raw value in the plot.
The values in the Stats and Raw tables can easily be copied/pasted to other programs for further analysis.

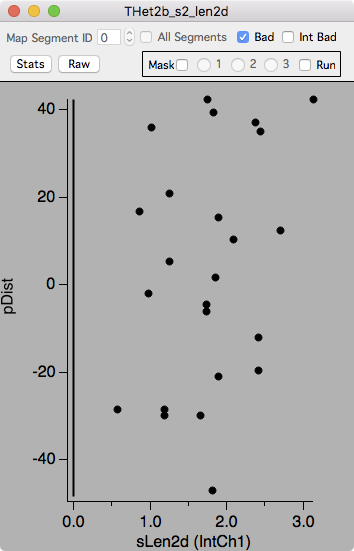
Spine Length 2D. Example stack plot of spine length in μm (sLen2d) versus spine position on its parent segment.
Advanced plotting
Make stack plots from the main plot panel.
